EXCEL #2
EXCEL HOMEWORK #2
PS 70 DR. M. ZABINSKI
- The entire sheet and a bar chart showing for the 2 columns the data of the 4 rows.
For example:

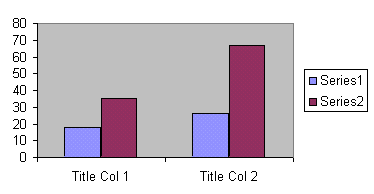
- The entire sheet and a bar chart showing for the 2 columns the data of rows 1 and 3 only.
For example:
- The entire sheet and a 2-D pie chart showing the pie chart for the 1st column. Be sure the pie chart is properly labeled.
EXTRA CREDIT
- Repeat (3) as a 3-D pie chart and show one slice "sticking" out.
Click here
to go back to the main page